At the FDA-AIChE Continuous Manufacturing (CM) workshop in Bethesda this year, I enjoyed the talk by Ahmad Almaya of Lilly on drug product CM, especially the part introducing 'funnel plots'.
These are a tool to determine for a given CM system and line flow rate the range of disturbance sizes and durations that can be handled before exiting product would drift out of specification. Disturbances could be caused by factors such as equipment failure or changeover in raw material properties; higher amplitudes are harder to deal with. Disturbance duration reflects how long it takes for such a problem to be detected and the control system response to be put in place; a quick response is obviously best.
In late June, we held a webinar to introduce our latest tool for CM, which calculates the residence time distributions of a sequence of operations (e.g. telescoped reactions and/or workup and isolation for Drug Substance; a sequence of Drug Product operations; or an end to end process). We simulated the response of the product stream to a series of disturbances and then generated the funnel plot shared below.
We think this is a very useful representation for use in filings and tech transfers and it's also easy to generate.
These are a tool to determine for a given CM system and line flow rate the range of disturbance sizes and durations that can be handled before exiting product would drift out of specification. Disturbances could be caused by factors such as equipment failure or changeover in raw material properties; higher amplitudes are harder to deal with. Disturbance duration reflects how long it takes for such a problem to be detected and the control system response to be put in place; a quick response is obviously best.
In late June, we held a webinar to introduce our latest tool for CM, which calculates the residence time distributions of a sequence of operations (e.g. telescoped reactions and/or workup and isolation for Drug Substance; a sequence of Drug Product operations; or an end to end process). We simulated the response of the product stream to a series of disturbances and then generated the funnel plot shared below.
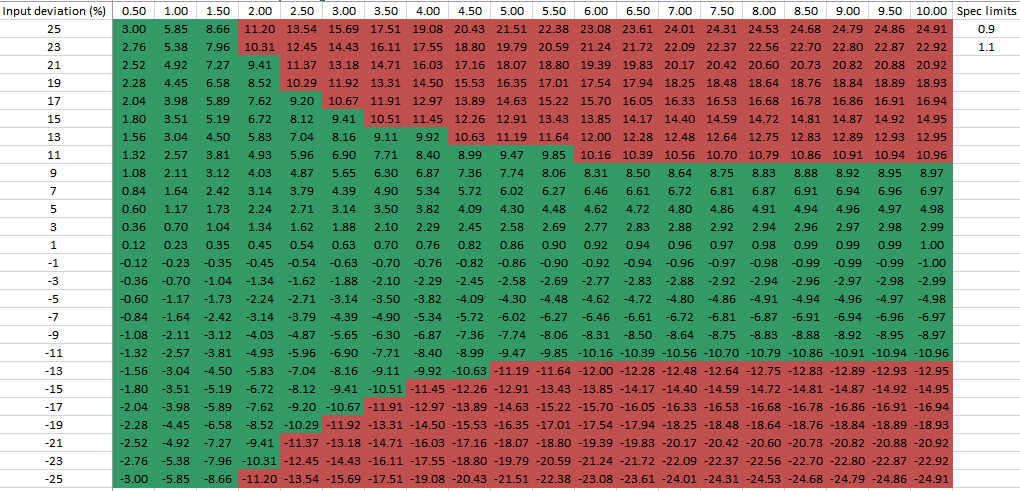 |
| Funnel plot for a CM process: Disturbance amplitude (here labeled 'deviation') on the y-axis and disturbance duration (min) on the x-axis. Any disturbance in the 'green zone' in this case keeps product in spec while the red zone results in OOS material. |