Solubility regression (once your solvents have been selected) is one of the most valuable things you can do for crystallization process design. We have provided tools for this for nearly 15 years and continue to enhance them in response to feedback from users. We recently improved our late phase tool, which has fitted every solubility(Temperature, antisolvent) dataset we have seen, to the point where you can have an expression within 1 minute of pasting in your data. There are also some sophisticated design calculations in our late phase tool that quickly lead to sensible process operating lines including cooling and addition rates.
Solubility prediction (in a range of solvents and mixtures before selection) is valuable at an earlier stage in process development, when you may know some of your process goals but lack knowledge about what solvents to focus on during fast paced early development. Measured data are scarce at this early phase; however ab initio predictions (e.g. from molecular structure or quantum chemistry) are either inaccurate, too specialized or both. We like methods that are a mix of predictive and correlative, i.e. that leverage a small set of experiments to predict behaviour in a vast array of solvents and mixtures.
NRTL-SAC is technically an attractive option in this area and is the subject of patents, making it unclear whether the published method can be implemented independently and incorporated in tools used to solve problems in industry. We decided in 2009 that we would not expose our customers to the intellectual property risks of using this method and instead dedicated a significant effort to producing an alternative. The result is a method called Regressed UNIFAC (RU), which makes the most of UNIFAC as a means to calculate solvent-solvent interactions and adds a new 'group' for solute, whose interaction parameters are fitted to data. These steps overcome limitations of standard UNIFAC and now most of our pharma customers rely on this method during early development of crystallization and also solvent selection for chemical reactions. You can download the tool here.
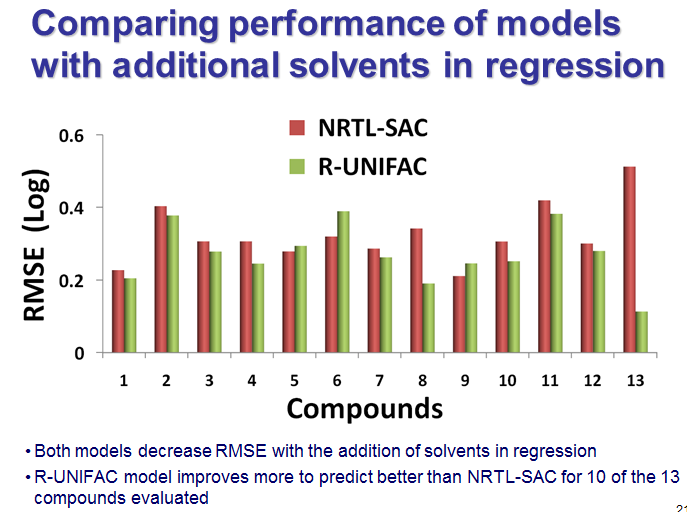
We tested the method for published solubility datasets and took steps to make it easy to use for our pharma customers; for example, you can work in friendly units, like g/L or even L/g and call any of the 160 solvents friendly names. That flows from our company culture that seeks to delight customers. We have been delighted too with the results in cases where RU was compared with NRTL-SAC, like the set of compounds below from a BMS presentation, which feature in a recorded webinar that DynoChem Resources website members can watch on demand anytime. The plot shows the relatives magntudes of the prediction errors for the two methods, for a total of 13 compounds. The green error bars for RU are smaller for 10 out of 13 compounds (77% of cases).
You can find out more about RU in knowledge base articles in DynoChem Resources. Let us know too if you would like to see features simplified or added.
Solubility prediction (in a range of solvents and mixtures before selection) is valuable at an earlier stage in process development, when you may know some of your process goals but lack knowledge about what solvents to focus on during fast paced early development. Measured data are scarce at this early phase; however ab initio predictions (e.g. from molecular structure or quantum chemistry) are either inaccurate, too specialized or both. We like methods that are a mix of predictive and correlative, i.e. that leverage a small set of experiments to predict behaviour in a vast array of solvents and mixtures.
NRTL-SAC is technically an attractive option in this area and is the subject of patents, making it unclear whether the published method can be implemented independently and incorporated in tools used to solve problems in industry. We decided in 2009 that we would not expose our customers to the intellectual property risks of using this method and instead dedicated a significant effort to producing an alternative. The result is a method called Regressed UNIFAC (RU), which makes the most of UNIFAC as a means to calculate solvent-solvent interactions and adds a new 'group' for solute, whose interaction parameters are fitted to data. These steps overcome limitations of standard UNIFAC and now most of our pharma customers rely on this method during early development of crystallization and also solvent selection for chemical reactions. You can download the tool here.
We tested the method for published solubility datasets and took steps to make it easy to use for our pharma customers; for example, you can work in friendly units, like g/L or even L/g and call any of the 160 solvents friendly names. That flows from our company culture that seeks to delight customers. We have been delighted too with the results in cases where RU was compared with NRTL-SAC, like the set of compounds below from a BMS presentation, which feature in a recorded webinar that DynoChem Resources website members can watch on demand anytime. The plot shows the relatives magntudes of the prediction errors for the two methods, for a total of 13 compounds. The green error bars for RU are smaller for 10 out of 13 compounds (77% of cases).
You can find out more about RU in knowledge base articles in DynoChem Resources. Let us know too if you would like to see features simplified or added.