Sunday, April 26, 2020

COVID-19 models at 26 April Ireland Italy and US

Our predictive models for Ireland, Italy and the US are stable and identical for each region, differing only in fitted parameter values (e.g. R0 and people movement versus time).  As the progress of COVID-19 is slowed by restrictions, the fitted parameter values for people movement have become more consistent from week to week.  Models with data to 26 April 2020 are available here as usual.
Good progress is being made and restrictions will be gradually loosened and occasionally re-tightened over the coming weeks and months, depending on trends in case numbers. 

Data for Ireland remains harder to interpret because of delayed testing results and some changes in the basis for reporting deaths this week.  A graph showing backdating of rest results was shared by the government on 23 April 2020 and we have used this to update the Ireland model; however there are spurious peaks (see below) and in addition, focused testing in care/nursing homes generated high case numbers this week that probably do not reflect a trend.  We therefore did not do a tight fit to the Ireland data.
Known case data for Ireland reported by the ECDC and a backdated version of the same information published on Thursday this week.  Both versions contain spurious trends that make direct use for parameter estimation difficult.
Approximate model fitted to backdated Ireland data indicates that the number of infectious in the first wave probably peaked around 1 April 2020.
Over the next weeks we will explore developing a more granular predictive model for the loosening of restrictions, especially focusing on the degree to which communities can return towards normality while those especially vulnerable remain protected. 

Sunday, April 19, 2020

COVID-19 at 19 April Ireland Italy and US

Each of the regions we have been modeling continues to make good progress against COVID-19 and some relaxation of the restrictions on people movement are being discussed or applied carefully with a view to avoiding second and later waves.

The numbers of infectious appear to have peaked clearly in Italy and the US.  The Ireland data has been harder to read because of around 3000 positive test results delivered three weeks late;  without a definitive restatement of the correct dates for those case numbers, it is difficult to be confident of the Ireland parameters at this time.

Models with current data are available as usual here.  Sample results are shown below.  As usual in the graphs below, discrete symbols are measured data (cases and deaths) and curves of the same colour are model predictions of those data.

Italy:

Predictive model fit to known cases and reported deaths from Italy indicates a peak in the number of infectious in mid March.

US:

Predictive model fit to known cases and reported deaths from Italy indicates a peak in the number of infectious at end March.

Sunday, April 12, 2020

COVID-19 models for Ireland, Italy and US - 11 April

Thanks again for all the positive feedback on this work.

In this week's update we have included data to 11 April for each region.  The structure of the predictive model is the same as before, with the additional calculation of deaths from the outbreak now included.  We have also simplified and we hope improved the workflow for application to other regions, by replacing the manual adjustment of an 'imposed' population mixing profile with use of the Dynochem Fitting window to fit a 'piecewise-linear' mixing profile to all case data (second scenario in the model).

The models (available here) fit very well to both cases and deaths in each region (first scenario for initial period and second for the outbreak to date).  The now usual caveats apply about known coronavirus case numbers: they lag and obscure real case numbers and their meaning varies depending on the testing criteria, volume and delay in each region and over time. Case data for Ireland has been muddled in recent days by the addition of results from swabs taken over the last month that took several weeks to test; we have attempted to reconcile this unhelpful number over the relevant period and refitted parameters for Ireland on that basis.

Each region's degree of control over the outbreak may be assessed by the current effective 'R', taking account of its original value (R0) and the restrictions.  R_effective should be near or preferably below 1 before restrictions can be safely relaxed for a short period (when it will rise).

The are many 'peaks' in such an outbreak and to say 'it has peaked' requires a more specific definition of the type of peak.  While infection rate may already have peaked (in the first wave), detection lags that, so peaks later; death rates also lag and peak later again.

Various peaks that occur in an outbreak like COVID-19, using model data for Ireland as an example.  Natural time lags as well as testing delays may cause peaks in infection, detection, death (on secondary y-axis) and ICU bed occupation rates to occur at different times.

As usual in the graphs below, discrete symbols are measured data (cases and deaths) and curves of the same colour are model predictions of those data.  'Mixing' reflects the reduced interaction of the population with each other.

Ireland:

Ireland: Including the burst of old case data results received this week, Ireland looks to have a little further to go before the first wave of the outbreak places peak demand on health services.  In order to bring that peak into April, the public will need to observe restrictions more tightly than at present.  Estimated current R_effective=1.1.  The peak infection rate may have occurred around 3 April.

Italy:

Italy: The first wave of the outbreak has recently passed the point of peak demand on health services. Peak infection rate was probably around 19 March. Estimated current R_effective=0.97.

United States (as a whole):

US: Peak infection rate may have occurred in early April.  Peak demand on the health services could be in late April or early May.  R_effective appears similar to Ireland at approximately 1.1.

Saturday, April 4, 2020

Coronavirus projections for Ireland, Italy and US

It is generally accepted that reported / known COVID-19 cases represent only a fraction of real cases; we continue to adopt a figure of about 22% known cases cumulatively for the outbreak as a whole.  Reported case numbers also depend on the criteria for testing, the volume of tests, the time taken to produce a test result and test accuracy;  all of these factors are in flux to some degree in most regions.  However known case data remains the best information that we have to assess the state of the outbreak and we continue to use those data in the models today.

Our model 3 (available here) tracks the population and predicts the numbers who have been exposed, infected, isolated and cured; it combines the (testing) time lag of detection relative to infection that we used in model 1, with the 22% cumulative detection rate we used in model 2 and represents a small evolution that we think improves it's correspondence with reality.  We see this as a fit for purpose model and future postings are unlikely to change the model much, only to apply it to the latest data.

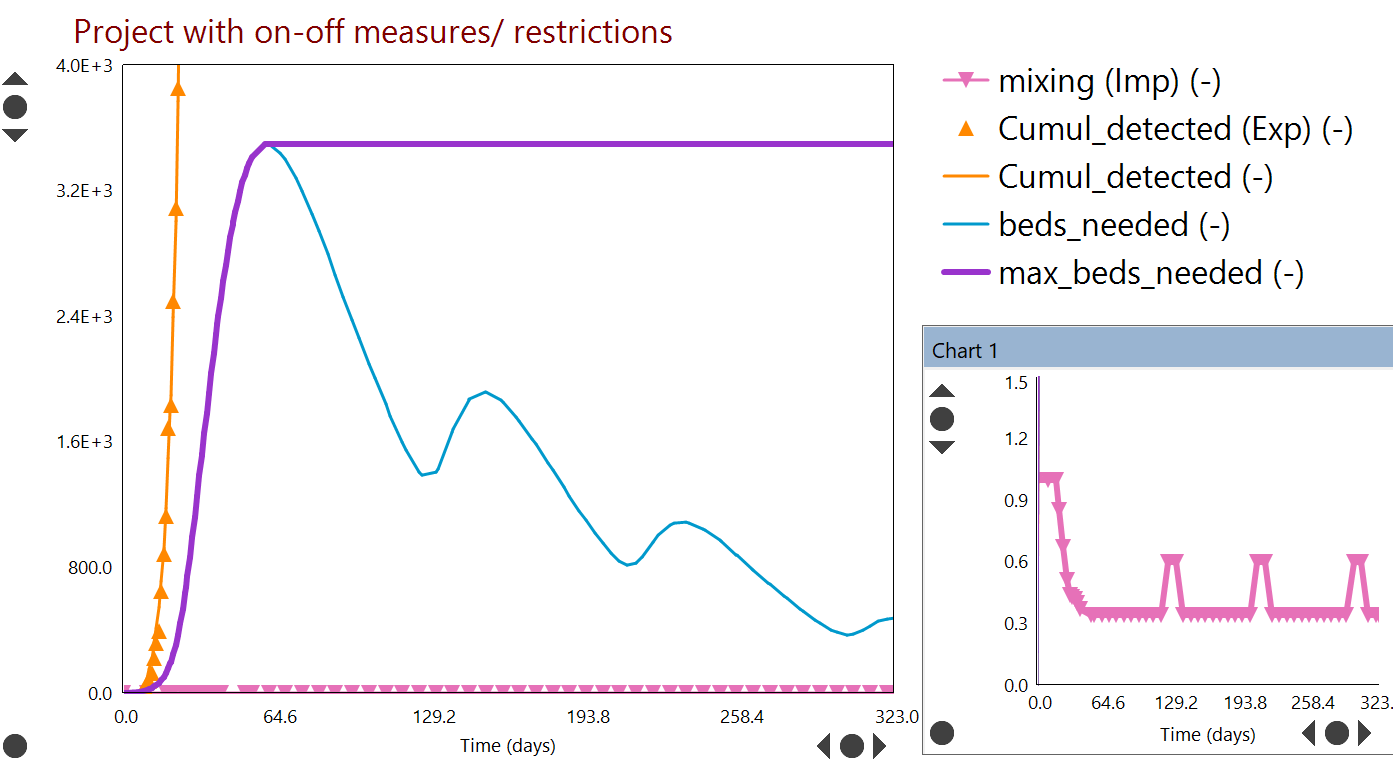
Results to date and projected to the end of 2020 are summarized below for Ireland, Italy and the United States.  Projections support the view that the month of April may see a peak in demand for ICU beds in each of those regions if the current restrictions are maintained and observed by the public.  Note that in each case, the estimated number of ICU beds needed is based on the number of known cases currently in isolation and assumes that 5% of those require an ICU bed.

The question of how to emerge from the pandemic is difficult, with indications that general restrictions similar to those currently in place cannot be relaxed much for the foreseeable future.  As usual in the plots, discrete symbols like 🔺indicate measured / real reported case data (denoted in the legend as 'Exp' for 'experimentally measured') and curves indicate model predictions.  When curves pass through symbols of the same colour, the model agrees well with measured data.  The 'mixing' variable [inset] is an indicator of the extent of people movement, with 1.0 as the base case (before restrictions) and lower values after restrictions have taken effect.

Ireland:

Ireland: If current restrictions remain in place [inset] and are observed by the public, the model suggests that peak ICU demand will be reached around day 63, between 20-27 April.  Relaxation of restrictions [inset] will lead to further peaks later in the year.

Italy:

Italy: If current restrictions remain in place [inset] and are observed by the public, the model suggests that peak ICU demand will be reached near day 61, around 13 April.  Relaxation of restrictions [inset] will lead to further peaks later in the year.

Unites States (as a whole):

United States: If current restrictions remain in place [inset] and are observed by the public, the model suggests that peak ICU demand will be reached around day 93, between 20-27 April.  Relaxation of restrictions [inset] will lead to further peaks later in the year.

ShareThis small